Create a project
Open BR-MANGUE Studio, create a project folder, and choose where the simulation outputs will be saved.
Practical guide
Prepare your inputs, map the classes, set a scenario, and inspect annual changes without leaving BR-MANGUE Studio.
Open BR-MANGUE Studio, create a project folder, and choose where the simulation outputs will be saved.
Select a categorical land-cover raster and an elevation raster with the same grid, extent, and coordinate reference.
Inspect the numeric codes and assign each one to mangrove, natural vegetation, water, anthropized or blocked, or another model role.
Set the years and coastal parameters, choose an engine, run the model, and explore annual maps, animation, trajectories, and CSV tables.
Workflow
Every screen is designed to keep the modelling decisions visible. Save the project before running so that input paths, class mapping, and parameters remain documented.
Inputs
Land-cover and elevation rasters must be aligned. The land-cover file is categorical; the elevation file supplies the relative surface used by the transition rules. A soil suitability layer is optional.
Processing engines
Keeps the active grid in RAM and avoids block-to-block disk I/O. Choose it when the raster fits comfortably in memory. The same state arrays are reused at every step, so adding years increases time, not RAM in direct proportion.
Copies the input state to persistent files, releases the materialized grid while the steps run, and processes one chunk at a time. Choose it for very large coastal rasters or long runs where capacity and recovery matter more than raw speed. The grid is reopened after the run when maps and figures need it.
Audit checklist
Before interpreting a map, record the raster sources, class mapping, coordinate reference, years, tidal influence, sea-level rise, block size, and processing engine.
User manual
The illustrated Portuguese manual explains cellular automata, neighbourhoods, raster preparation, every interface field, processing engines, outputs, troubleshooting, and reproducibility.
Download the illustrated PDFDemonstration run
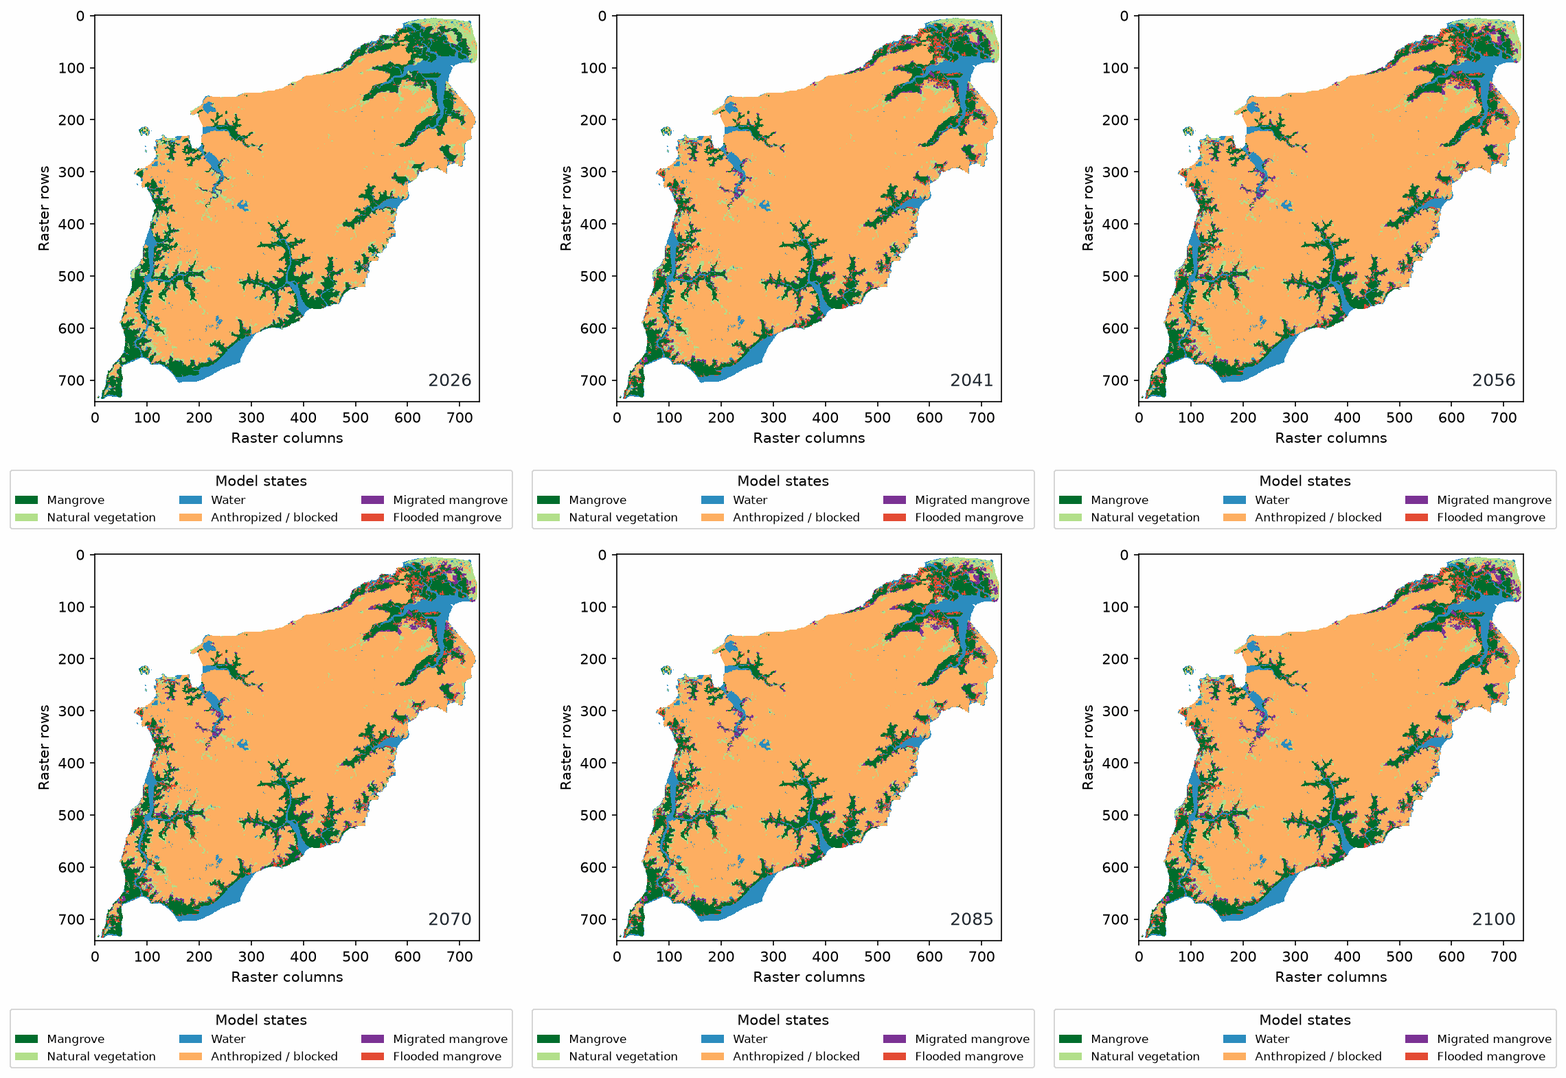
This animation was generated directly by BR-MANGUE Studio from the Ilha de São Luís demonstration run (2025–2100; 1,083,556 cells). It is an illustrative example of the workflow, not a predictive result for the island.
The complete figures and CSV outputs are documented in the manual and generated in the results folder after each run.